
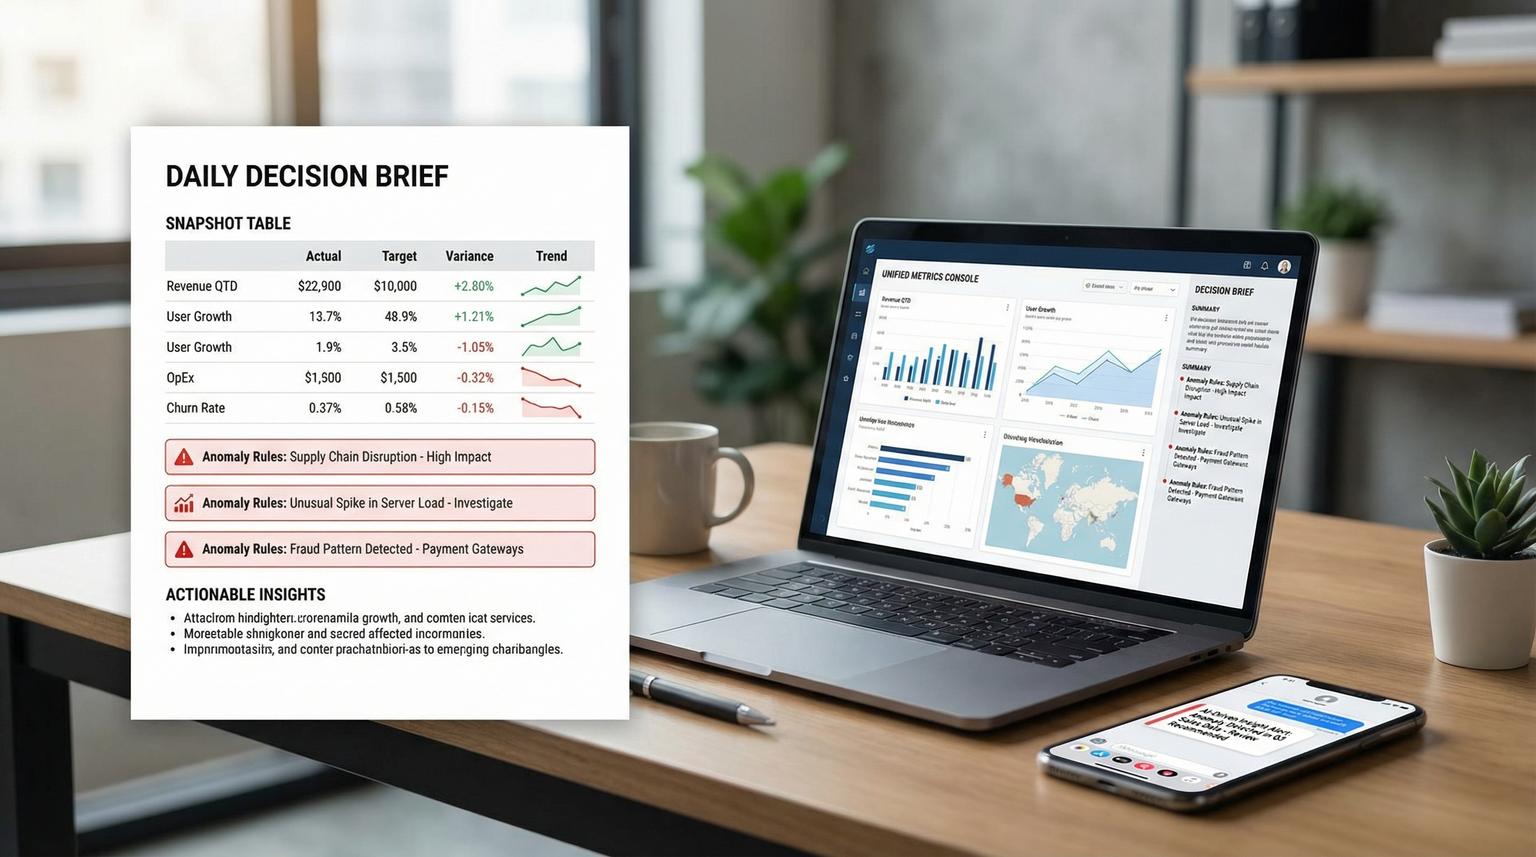
Leaders do not need more dashboards. They need a short brief that explains what changed, what matters and what to do next. This is where AI-driven business intelligence solutions earn their keep, but only when the AI is summarizing trusted metrics instead of guessing across siloed apps. In this article we will design an operational workflow that pulls from CRM, billing and support systems then normalizes the data into a shared metric layer, detects anomalies and delivers a daily Decision Brief plus targeted Slack or Teams alerts.
This is written for business owners, ops leaders and RevOps or support managers who already live in tools like HubSpot, Stripe or Chargebee and Zendesk and want reliable KPI visibility without building a full BI team.
Quick summary:
- Normalize CRM, billing and support events into conformed fact tables then compute metrics in one governed metric layer.
- Materialize a daily metrics snapshot table that becomes the single input contract for your executive Decision Brief.
- Run deterministic anomaly rules (drop, spike, trend breaks) and route deduped alerts to Slack or Teams with drill-down links.
- Use the LLM only for last-mile narrative, not for joins or KPI definitions.
Quick start
- Pick 8 to 15 leadership KPIs across pipeline, revenue and support and define exact formulas and grains.
- Extract incrementally from each system into a raw landing store then transform into normalized fact tables.
- Build a metric layer (semantic definitions) that exposes consistent metrics and dimensions for slicing.
- Schedule a daily query to write a single
decision_brief_dailytable and publish a completion event. - Evaluate anomaly rules into an
anomalies_dailytable then send Slack or Teams alerts with dedupe and rate limits. - Generate the narrative brief from the daily snapshot plus anomaly flags then post it to leadership channels.
A practical way to build this is to centralize CRM, billing and support data into normalized warehouse tables, define metrics once in a governed metric layer then schedule a daily materialized snapshot. An anomaly job compares todays snapshot to a baseline window and writes alert rows that a notifier dedupes and posts to Slack or Teams. Finally an LLM turns the validated numbers into a plain-language Decision Brief with links for drill-down so leaders can act quickly without manual reporting.
The architecture that keeps AI honest
The most common failure pattern we see is teams asking an LLM to pull data and summarize it directly from three APIs. It looks fast until metrics disagree across teams or the brief changes wording but not logic then trust drops. The fix is to draw a clear boundary: upstream systems and logic create verified metrics and the LLM only narrates.
Here is the reference architecture we implement for clients using n8n or a similar orchestrator:
- Extract layer: incremental pulls from CRM, billing and support APIs into a raw landing area (object storage or raw tables).
- Normalize layer: dbt or SQL transforms into conformed fact and dimension tables with stable keys and controlled grain.
- Metric layer: a semantic layer that defines entities, measures, dimensions and metrics once, similar to how the dbt Semantic Layer models joins and aggregations.
- Daily materialization: scheduled queries write a single daily snapshot table and a parallel anomaly candidates table, using scheduled queries or your warehouse scheduler.
- Anomaly and alerting: rule evaluation writes alert rows, then a notification layer handles grouping, dedupe, rate-limits and routing, borrowing the separation of rules vs routing from Prometheus alerting rules.
- Narrative generation: the LLM receives only the daily snapshot plus anomaly rows and produces a short brief with drill-down links.
- Delivery: Slack incoming webhooks or Teams connectors post the brief and alerts, using structured formatting such as Slack incoming webhooks.

Where to store the joined data
Store joined and computed metrics in a warehouse table that is easy to query and audit. A simple pattern is:
fact_crm_pipeline_daily(grain: date x owner x stage)fact_billing_ledger_daily(grain: date x customer x currency)fact_support_tickets_daily(grain: date x queue x priority)decision_brief_daily(grain: date; includes headline KPIs plus key slices)anomalies_daily(grain: date x metric x segment; includes severity and status)decision_brief_narratives(grain: date; stores generated sections and message IDs)
This gives you replayability. If leadership disputes a number you can trace it from narrative to metric snapshot to source facts.
Data normalization design for CRM, billing and support
Normalization is where correctness lives. Your goal is to make three systems behave like one analytics product with consistent identifiers and time handling.
Recommended conformed entities
- account_id: the master customer or company identifier used across systems.
- contact_id: optional, for lead to account mapping.
- owner_id: sales rep or CSM mapping.
- agent_id: support agent mapping.
- date: canonical business day in one timezone, with a clear definition of day boundaries.
Fact tables and grain rules
Pick grains that prevent double counting. A practical decision rule is: if the same real-world event can appear multiple times in a system, normalize it into an event fact table and aggregate later through the metric layer.
- CRM: opportunities and stage changes. Keep one row per opportunity per stage-change event then derive daily pipeline metrics from it.
- Billing: invoices, payments, refunds and subscription events. Keep a ledger-like table so revenue, MRR movement and refunds are explainable.
- Support: ticket events and snapshots. Use incremental exports so you are not re-pulling history. Zendesk supports cursor-based incremental exports which are designed for high volume daily syncs: incremental exports.
Checklist for grain and entity mapping (use this before involving the LLM)
- Every fact table has exactly one declared grain (for example one row per ticket event) and that grain is documented.
- Primary keys are stable and unique. If you cannot guarantee uniqueness, build a deterministic surrogate key.
- Time fields are normalized into one timezone and one canonical date column.
- Account mapping rules are explicit (for example billing customer_id to CRM company_id) and stored in a mapping table with audit fields.
- Joins are tested for row explosion. If a join increases row count unexpectedly, fix the relationship or aggregate first.
- All KPI formulas reference the same base measures, not duplicated SQL scattered across jobs.
Build a metric layer that powers the Decision Brief
A metric layer (semantic layer) is the contract between data and narrative. It prevents metric drift by defining measures, dimensions and join paths once and reusing them everywhere. This is why we like semantic-layer approaches such as MetricFlow concepts in the dbt ecosystem: the LLM does not need to know how to join tables, it just summarizes the output. For a related pattern using n8n to keep unified analytics trustworthy, see AI-driven business intelligence dashboards with n8n.
Example metric layer spec for leadership KPIs
You can implement this in dbt Semantic Layer, a custom metrics service or even a well-governed SQL view layer. The key is consistent definitions.
| Domain | Metric | Definition | Core dimensions for drill-down |
|---|---|---|---|
| CRM | New leads | Count of created leads for the day | source, region, owner |
| CRM | Lead to opp conversion | Opps created / leads created over a window | source, owner |
| Billing | MRR | Sum of active subscription monthly recurring revenue | plan, region, currency |
| Billing | Refund rate | Refunds / gross payments over a window | plan, payment_method |
| Support | Ticket backlog | Count of open tickets at end of day | priority, queue |
| Support | SLA risk | % tickets within X hours of breach threshold | priority, queue, agent |
Real-world ops insight: keep the Decision Brief metric set small and stable. When you rotate KPI definitions weekly, executives stop reading because the numbers feel like they move for political reasons. Add new metrics only when you have an owner who will maintain the underlying mapping and drill-down links.
Materialize the daily snapshot and make it triggerable
The daily Decision Brief works best when it is based on a single materialized dataset created at a known time. This is more reliable than querying live tables at message time because it isolates late-arriving data and it makes anomalies reproducible.
Daily tables to write
decision_brief_daily: one row per day with headline KPIs plus structured JSON columns for top segments and drill-down URLs.decision_brief_segments_daily: optional, multiple rows per day for ranked segments (top sources, plans, queues).anomaly_candidates_daily: computed comparisons such as day-over-day change, week-over-week change and rolling baselines.
Scheduling and triggering pattern
In BigQuery you can schedule the snapshot query to overwrite the destination table daily and publish a completion notification to Pub/Sub, which then triggers the next steps. The same pattern exists in other warehouses and orchestrators. The advantage of the event trigger is that your LLM and alert jobs run only after fresh data is confirmed. If you want the bigger operational playbook for designing, evaluating, and operating these AI steps with strict contracts and guardrails, use this pillar guide: AI workflow automation playbook.
Example CLI pattern for a scheduled query job (trimmed for readability):
bq query \
--use_legacy_sql=false \
--destination_table=bi.decision_brief_daily \
--display_name='Decision Brief Daily Snapshot' \
--schedule='every 24 hours' \
--replace=true \
'SELECT * FROM bi.vw_decision_brief_daily'
Tradeoff to decide early: overwrite vs append. Overwrite keeps one canonical row per date and avoids duplicates. Append can help if you want multiple runs per day but you must then select the latest successful run in downstream jobs. For most leadership briefs, overwrite plus a separate run log table is simpler.
Anomaly rules that are measurable, deduped and actionable
Anomalies should be computed from the same metric layer outputs. That keeps alert math consistent with the brief. You do not need complex machine learning at first. Deterministic rules catch most revenue-impacting issues when they are well-scoped and tuned.

Rule types we see work well
- Percent change vs baseline: alert when todays value is down or up more than X% vs the rolling 7-day average.
- Thresholds with context: alert when ticket backlog exceeds N and is rising for 2 consecutive days.
- Ratio breaks: conversion rate drop or refund rate spike, guarded by minimum volume to avoid noise.
- Hold duration: require the condition to persist for N checks before alerting to reduce flapping, similar to Prometheus rule semantics.
Store anomalies with a stable fingerprint
Create an anomalies_daily table with fields like:
alert_fingerprint(hash of metric_name + segment + direction + window)run_date,metric_name,segment_key,severitycurrent_value,baseline_value,delta_pctstatus(new, ongoing, resolved)first_seen_date,last_seen_datenotification_count,last_notified_at
This table becomes your dedupe and rate-limit mechanism. Your notifier job posts only when status changes to new or when an ongoing alert crosses a re-notify interval.
Common mistake that causes noisy alerts
If you alert on percent change without a minimum volume gate you will spam people. A 50% drop in leads from 2 to 1 is not actionable. Always add a guard condition like baseline_value >= 20 for lead volume or payments_count >= 10 for refund rate spikes. This one tweak typically cuts alert noise dramatically.
LLM narrative generation and Slack or Teams delivery
Once you have a daily snapshot and a deterministic anomaly table, the LLM prompt becomes simple and reliable. It should not be asked to calculate KPIs. It should be asked to explain the KPIs you already computed and to format them for humans.
Input contract for the LLM
- One row from
decision_brief_daily(headline KPIs and top slices) - Top N rows from
anomalies_dailywherestatus in ('new','ongoing') - A small dictionary of drill-down links (CRM view URLs, billing reports, support queue views and warehouse query links)
- Optional: a short policy block for tone and recommended next actions based on anomaly type
Slack webhook payload example for an anomaly alert
This is a lightweight format that works well with Slack incoming webhooks. Treat the webhook URL like a secret.
{
"text": "Anomaly: MRR down 8.4% vs 7-day baseline",
"blocks": [
{"type": "header", "text": {"type": "plain_text", "text": "KPI Anomaly Alert"}},
{"type": "section", "fields": [
{"type": "mrkdwn", "text": "*Metric*\nMRR"},
{"type": "mrkdwn", "text": "*Segment*\nAll plans"},
{"type": "mrkdwn", "text": "*Today*\n$112,400"},
{"type": "mrkdwn", "text": "*Baseline*\n$122,700"}
]},
{"type": "section", "text": {"type": "mrkdwn", "text": "*Suggested next actions*\n1) Check failed payments and churn events\n2) Review top 10 downgrades\n3) Validate any billing system outages"}},
{"type": "section", "text": {"type": "mrkdwn", "text": "Drill-down: Billing report link | Warehouse query link"}},
{"type": "context", "elements": [
{"type": "mrkdwn", "text": "alert_id=ALRT_2026_04_05_mrr_all baseline=7d hold=2d"}
]}
]
}
How alerts are triggered and delivered
- Trigger: snapshot query completes and emits an event (for example Pub/Sub) or your orchestrator marks the run successful.
- Detection job: computes anomalies and upserts
anomalies_dailywith status transitions. - Notifier: selects alert rows that should notify (new or re-notify) then posts to Slack or Teams.
- Decision Brief poster: calls the LLM with the daily snapshot and anomalies then posts the brief, optionally threading individual anomaly alerts under the daily brief message to reduce noise.
When this approach is not the best fit: if you need near-real-time fraud monitoring, high-frequency marketplace pricing or sub-hourly incident response, a daily brief is too slow. In that case build a streaming metric pipeline with real-time alerting and use the LLM for incident summaries instead of daily ops briefs.
Rollout, monitoring and guardrails for production
A Decision Brief becomes a core operational dependency. Treat it like a product with owners and failure handling.
Minimal runbook that prevents silent failures
- Ownership: assign one business owner for KPI definitions and one technical owner for pipeline reliability.
- Freshness checks: verify source extractions ran and the snapshot table updated for the day before posting.
- Idempotency: store run IDs and message IDs so re-runs do not double-post.
- Late data handling: if billing data arrives late, either delay the brief or publish a brief with a clear data freshness note and auto-post an update when complete.
- Security: keep Slack webhook URLs in a secrets manager and restrict service accounts to least privilege.
- Auditability: store the exact metrics snapshot and generated narrative text for each day.
If you want ThinkBot Agency to design and implement this end-to-end in n8n or your preferred stack, you can book a consultation and we will map your systems, KPIs and alert semantics into a production-ready workflow. If you are also trying to streamline the underlying ops workflows end-to-end, this guide on AI-driven business process optimization pairs well with the Decision Brief approach.
FAQ
Common implementation questions we get when teams roll out a daily Decision Brief plus anomaly alerts.
What KPIs should a daily Decision Brief include from CRM, billing and support?
Start with a small set that executives actually act on: new leads, lead to opportunity conversion, pipeline created, closed won revenue, MRR, refunds or chargebacks, churn signals, ticket backlog, first response time and SLA risk. Add dimensions for drill-down like owner, plan, region and priority so the brief can point to where the change occurred.
How do you prevent metric drift when multiple teams use the same data?
Define metrics once in a governed metric layer on top of normalized tables and make every consumer use that layer. Keep grains explicit, standardize entity keys like account_id and test joins for row explosion. The LLM should only summarize metric outputs, not rebuild KPI logic in prompts.
What anomaly rules work best before using advanced machine learning?
Percent change vs a rolling baseline, ratio breaks (like conversion rate and refund rate) and threshold plus trend rules cover most operational needs. Add minimum volume gates and a hold duration so anomalies must persist before alerting. Store alerts with fingerprints to dedupe and rate-limit notifications.
Where should the daily joined metrics and the generated narrative be stored?
Store joined daily metrics in a warehouse table like decision_brief_daily and store anomalies in anomalies_daily so you can audit and replay. Store the generated narrative in a decision_brief_narratives table with the run ID and Slack or Teams message ID. This makes the brief traceable and prevents double-posting on retries.
Can this be implemented with n8n and Slack or Teams?
Yes. n8n can orchestrate incremental API extraction, trigger warehouse jobs and call an LLM then post to Slack via incoming webhooks or to Teams via connectors. The key is sequencing: refresh data, materialize the snapshot, compute anomalies, then generate and deliver the narrative and alerts with dedupe.