
Most teams automate a process in n8n, confirm it runs, then struggle to improve it because they cannot measure it end-to-end. This is where data-driven business process optimization either becomes real or stays a slogan. In this article we will instrument any workflow from intake to validation to handoff to completion so ops teams can see cycle time, touchless rate, exception reasons and duplicates in one place. You will leave with an event schema you can reuse, alert thresholds that predict pain and a monthly improvement cadence that turns metrics into prioritized workflow changes.
Quick summary:
- Use two layers of telemetry: n8n platform logs for reliability and custom KPI events for operational outcomes.
- Emit standardized events at intake, validation, handoff and completion so every run is measurable.
- Add boundary data-quality checks so you detect drift and duplicates before they create CRM rework.
- Route all events into one analytics destination with thresholds tied to a specific automation fix.
Quick start
- Pick one workflow and define its entity_id (lead_id, ticket_id, order_id) and SLA target.
- Add four HTTP Request nodes that emit KPI events at intake, validation, handoff and completion.
- Implement one data-quality gate at validation (schema and duplicate checks) and emit pass or fail reasons.
- Send events to a single store (warehouse table or logging index) then build a dashboard for cycle time, touchless rate, exception reasons and duplicate rate.
- Create three alerts (dropped requests, SLA risk and duplicate spikes) and map each alert to one concrete workflow change.
To optimize n8n workflows with real operational rigor, treat measurement like a system: emit a small set of standardized KPI events from key stages, store them outside n8n for long-term reporting and alert on thresholds that predict rework and SLA misses. Then run a monthly review that uses the telemetry to pick the next one or two workflow improvements based on impact. This turns automation into a measurable pipeline rather than a set of scripts.
Why most automations never get optimized in production
The common failure pattern we see is not that the workflow fails every time. It is that teams cannot answer simple questions two months later:
- How long does the process take from intake to completion by request type?
- What percentage was touchless with no manual steps and no exceptions?
- What are the top three exception reasons that create rework?
- Are duplicates increasing and where do they enter the system?
If your only data source is n8n execution history, the picture will be incomplete. Execution data is designed for debugging, not for being your system of record. It is also subject to retention and pruning which can delete the history you need for monthly trend analysis. n8n itself documents these constraints in its execution data retention and pruning settings.
The fix is to separate infrastructure telemetry (did it run) from business telemetry (did it produce the right outcome fast enough with clean data). You need both.
A two-layer telemetry architecture for n8n workflows
Think of your measurement stack as two streams that land in the same observability or analytics destination.
Layer 1: platform and reliability telemetry
If you are on a plan that supports it, enable n8n log streaming to push workflow lifecycle events, node timing and audit events to your logging destination. This gives you baseline visibility into failures, timeouts and change risk (credentials changed, workflow activated, execution data deleted).
Layer 2: KPI-grade business events
From inside the workflow, emit your own events that represent the business process stages: intake, validation, handoff and completion. These are low-volume, standardized and designed for dashboards. They are also stable even if you later refactor nodes because the stage events remain consistent.
Decision rule: use n8n execution data for short-horizon debugging and root cause analysis. Use an external event store for KPI reporting, alerting and monthly optimization. This avoids losing history to pruning and avoids dashboards breaking when you change workflow internals.

Event schema and KPI list you can reuse across workflows
The fastest way to get trustworthy measurement is to standardize the envelope across all workflows. Your event name and stage tell you what happened. Your IDs let you correlate events into a single process run. Your metrics let you compute KPIs without parsing logs.
Concrete KPI event schema
| Field | Type | Example | Why it matters |
|---|---|---|---|
| event_name | string | bp.stage.completed | Stable taxonomy for dashboards and alert routing |
| ts | ISO string | 2026-05-09T14:22:18Z | Time series analysis and ordering |
| workflow_id | string | lead-intake-v3 | Rollups by workflow version or family |
| execution_id | string | {{ $execution.id }} | Correlate multiple events in one n8n run |
| entity_type | string | lead | Shared schema across domains (lead, ticket, order) |
| entity_id | string | hubspot:12345 | De-duplication and traceability in ops tools |
| stage | string | validation | Standard boundary measurement (intake, validation, handoff, completion) |
| status | string | ok | Success vs exception without digging into logs |
| duration_ms | number | 8420 | Stage latency and cycle-time calculations |
| touchless | boolean | true | Compute touchless rate and identify manual leakage |
| exception_reason | string | missing_required_field | Low-cardinality reasons for Pareto analysis |
| duplicate_detected | boolean | false | Duplicate rate and where duplicates enter |
| dq_status | string | pass | Data-quality outcomes tied to validation gates |
| dq_failure_category | string | type_mismatch | Actionable categories for alerts and fixes |
| customer_tier | string | enterprise | Prioritize issues by business impact |
| slo_minutes | number | 60 | SLA risk scoring and alert thresholds |
KPI list (minimum viable set)
- Cycle time: end-to-end duration from intake to completion, plus stage durations to locate bottlenecks.
- Touchless rate: percent of runs with touchless=true and no exception stages.
- Exception reasons: distribution of exception_reason values, kept intentionally low-cardinality.
- Duplicate rate: percent of runs where duplicate_detected=true at intake or validation.
Real-world ops insight: do not start by logging everything. High-cardinality fields like full error stacks, raw payloads and free-text reasons will blow up dashboards and make alerting noisy. Keep KPI events small and stable. If you need forensic detail, keep it in logs or a separate error store keyed by execution_id.
How to emit KPI events from n8n at the four boundaries
For most teams the simplest pattern is a dedicated HTTP endpoint that accepts JSON events and writes them to your analytics destination. In n8n you send the event with the built-in HTTP Request node. n8n documents configuration options and the cURL import workflow in its HTTP Request node documentation. If you need a full end-to-end example with validation gates and reliability guardrails, see our no-code workflow automation blueprint for lead-to-invoice in n8n.
Placement: intake, validation, handoff, completion
- Intake: immediately after the trigger (webhook, email, form, CRM event). Log request received, source and entity_id.
- Validation: after parsing and normalization and after data-quality checks. Log pass or fail plus failure category.
- Handoff: after you write to the destination system or create the next task (CRM record, ticket, invoice, Slack notification). Log status, duration and whether human work was required.
- Completion: when the workflow has produced the final output and closed the loop (confirmation sent, ticket assigned, CRM updated). Log end-to-end duration and touchless outcome.

Payload template (paste into HTTP Request node using JSON mode)
{
"event_name": "bp.stage.completed",
"ts": "={{ $now.toISO() }}",
"workflow_id": "lead-intake-v3",
"execution_id": "={{ $execution.id }}",
"entity_type": "lead",
"entity_id": "={{ $json.leadId }}",
"stage": "validation",
"status": "ok",
"duration_ms": "={{ $json.validationDurationMs }}",
"touchless": "={{ $json.touchless }}",
"exception_reason": "={{ $json.exceptionReason || '' }}",
"duplicate_detected": "={{ $json.duplicateDetected || false }}",
"dq_status": "={{ $json.dqStatus || 'na' }}",
"dq_failure_category": "={{ $json.dqFailureCategory || '' }}",
"slo_minutes": 60
}
Implementation detail that saves time: when you import cURL configs into the HTTP Request node, values may default to strings. For numeric fields like duration_ms and boolean fields like touchless and duplicate_detected switch to JSON body mode and ensure the event store can parse types correctly. Otherwise your dashboard math will be wrong.
Common mistake: emitting only on success
If you only send completion events, you will undercount dropped requests and you will never see where work stops. Emit events on exception branches too. A simple pattern is to use an IF node for validation outcomes then send bp.stage.exception events with a constrained reason code. This is what makes exception reasons useful for Pareto analysis instead of an unsearchable pile of error text.
Data quality checks at boundaries that prevent rework and duplicates
Most operational pain comes from bad data crossing a boundary: a form changes, a field type flips, a downstream system rejects a payload or duplicates sneak in and create a cleanup project. Add quality checks where they are cheapest: at validation and at handoff.
Schema validation (drift detection)
For structured datasets, schema validation catches breaking and subtle changes before they corrupt your CRM or analytics. Great Expectations provides a practical approach to define an expectation suite and validate incoming batches against it as described in its reference on schema validation.
In n8n this can look like:
- Normalize incoming data into a canonical object (your internal schema).
- Run a schema check step (via a small Python microservice, a serverless function or a database constraint check) and return dq_status plus dq_failure_category.
- Only allow the handoff stage to run when dq_status=pass.
- Emit dq fields in your stage events so you can trend failures over time.
Tradeoff to decide up front: strict vs relaxed schema checks. Strict checks (types and exact column sets and sometimes order) reduce downstream surprises but can block legitimate new fields. Relaxed checks (required fields only) keep throughput high but increase the risk of silent data degradation. If your downstream depends on exact fields for API calls, strict is safer at handoff.
Duplicate detection (idempotency at intake)
Duplicate rate is one of the best early indicators that a workflow is about to become expensive. Causes include retries without idempotency, multiple triggers firing for the same entity or upstream systems sending replays.
A lightweight duplicate check pattern:
- Derive a deterministic idempotency_key at intake (entity_id plus stage plus business date or request hash).
- Look up the key in a small store (Redis, database table or even a CRM custom object).
- If seen, mark duplicate_detected=true and short-circuit the workflow or route to a review lane.
- Emit an exception event with exception_reason=duplicate_request and include where it was detected (intake vs validation).
Routing events into a dashboard and setting alert thresholds that predict pain
You can route events to many destinations. The operational requirement is consistency: one schema, one place to query, one place to alert. Two common patterns we implement for clients:
- Analytics-first: store events in a warehouse table (bp_events) then build dashboards and alerts on top of it.
- Observability-first: store events in a log index then aggregate into KPIs with saved searches and alerts.
Either way, create one dataset with a partition on date and indexes on workflow_id, entity_id and stage. Keep payloads small so storage and query costs remain predictable.
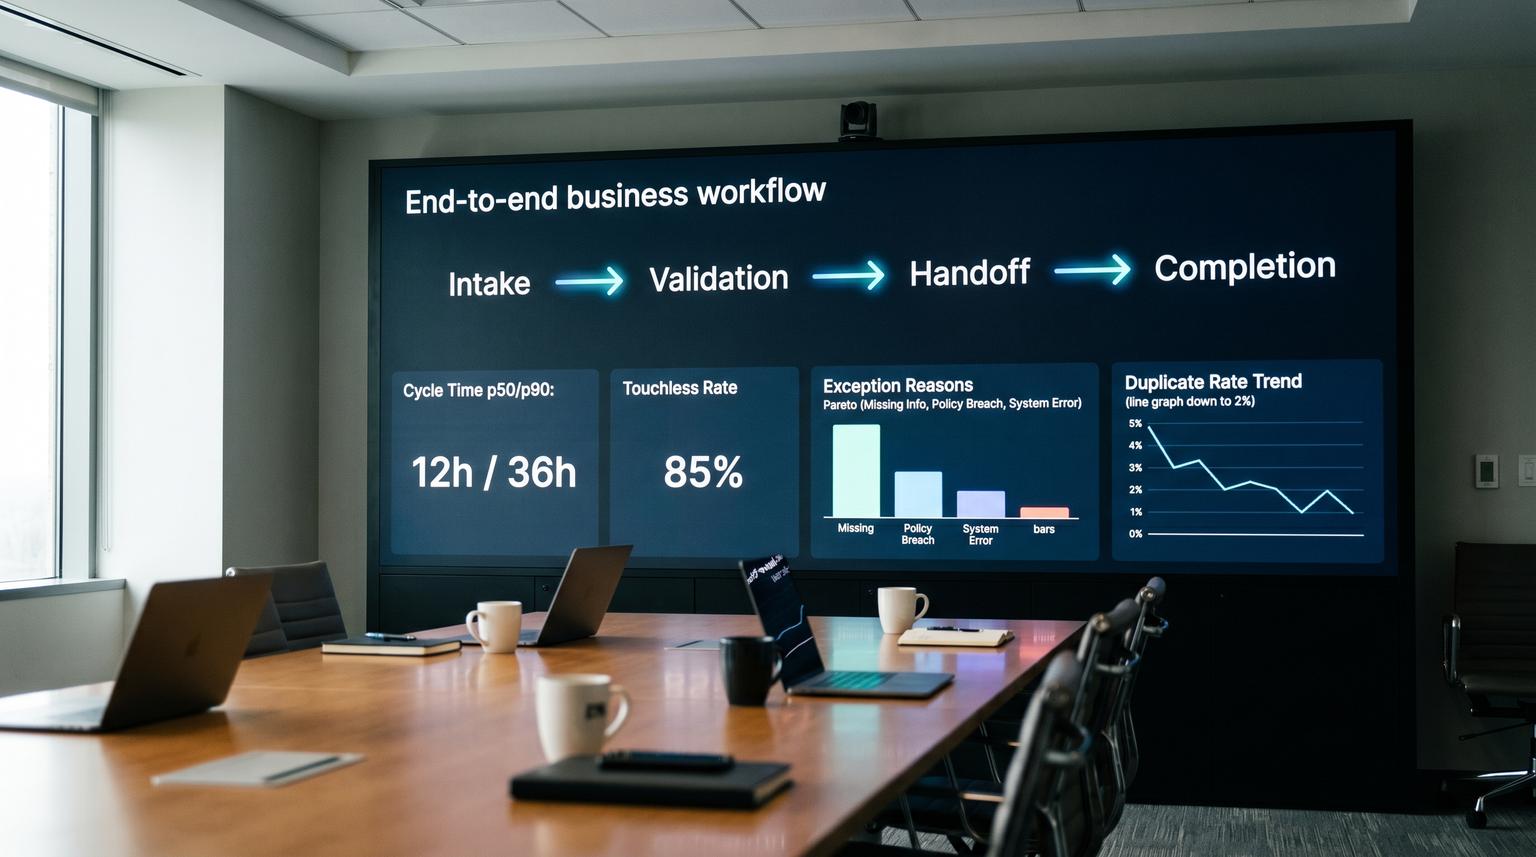
Suggested dashboard views
- Funnel by stage: intake count vs completion count (drop rate).
- Cycle time distribution: p50, p90 and max for end-to-end and per stage.
- Touchless rate trend: weekly or daily, segmented by source and customer tier.
- Exception Pareto: top exception reasons over the last 30 days.
- Duplicate rate trend: overall and by trigger type.
Alert thresholds tied to automation fixes
Alerts should not just notify. Each alert should map to a concrete workflow change, otherwise teams ignore them. Here is a practical starting set you can tune:
| Alert | Threshold (starting point) | How to compute | Typical automation fix |
|---|---|---|---|
| Dropped requests | > 2% intake without completion in 60 minutes | intake_count - completion_count by workflow_id and time window | Add missing error handling, add retries with backoff, add dead-letter queue and emit exception_reason consistently |
| SLA risk | p90 cycle time > 0.8 * SLO for 2 hours | p90(end_to_end_duration) compared to slo_minutes | Reduce wait states, parallelize lookups, move slow enrichment async, add timeouts and circuit breakers on external APIs |
| Duplicate spike | duplicate_rate > 0.5% daily or 3x baseline | count(duplicate_detected=true) / total | Add idempotency_key store, dedupe before write, de-conflict triggers, enforce upsert semantics in CRM writes |
| Data quality failures | dq_fail_rate > 1% daily or any breaking category | dq_status=fail grouped by dq_failure_category | Update normalization, add schema mapping, coordinate upstream change, tighten or relax expectations based on impact |
When this approach is not the best fit: if the process volume is extremely low (for example a handful of requests per month) you may get more value from a simpler manual postmortem process than building full telemetry and alerting. Also if you are in the middle of a major process redesign, use the telemetry to learn but consider a redesign method rather than incremental optimization. For a broader view on where automation fits into optimization programs, read Unlocking Business Process Optimization with Automation.
A monthly continuous improvement loop that turns metrics into prioritized workflow changes
The point of instrumentation is not reporting. It is choosing the next changes based on impact, not opinions. A reliable cadence is a lightweight monthly DMAIC-style loop adapted from the ASQ DMAIC structure.
Define (30 minutes)
- Pick one workflow scope (intake to completion).
- Confirm KPI definitions (cycle time, touchless, duplicates, exception reasons) and a single source of truth dataset.
- Set the month goal: for example reduce p90 cycle time by 20% or cut duplicate rate in half.
Measure (60 minutes)
- Pull last 30 days of events.
- Compute baseline: p50 and p90 cycle time, touchless rate, drop rate, top exceptions and duplicate rate.
Analyze (60 minutes)
- Build a Pareto of exception_reason and dq_failure_category.
- Correlate exceptions with cycle time spikes and drop-offs by stage.
- Find one bottleneck stage where duration_ms dominates p90.
Improve (1 to 2 weeks, small batch)
- Select the top 1 or 2 changes with the highest impact and lowest risk.
- Ship behind a safe rollout: feature flags, versioned workflow_id and a rollback path.
- Add or adjust KPI events if the change introduces a new boundary or failure mode. If you want a step-by-step method to map and standardize processes before iterating on metrics, use our pillar guide: business process automation playbook to map, standardize, and automate back-office workflows.
Control (ongoing)
- Keep the alerts that predict pain: drop rate, SLA risk, duplicates and data quality failures.
- Document a short runbook per alert with the first check and the default fix path.
- Review thresholds quarterly so you do not normalize bad performance. If you need help prioritizing which workflows to instrument next, run a quick scoring exercise like our one-department ROI audit for business process automation benefits.
If you want help implementing this telemetry layer in n8n and wiring it into your dashboards and alerts, book a consultation with ThinkBot Agency. We can instrument one workflow end-to-end, set up the event store and alerting and leave your team with a repeatable monthly optimization routine.
FAQ
Common implementation questions we hear from ops teams and technical founders when they start measuring automated processes.
Do I need n8n Enterprise log streaming to do this?
No. Log streaming is helpful for platform-level visibility but the KPI event layer can be emitted from any n8n plan using HTTP Request nodes. The key is to store KPI events outside n8n so pruning of execution history does not erase your optimization data.
Where should I store workflow KPI events?
Store them in one analytics destination that your team already uses for reporting and alerting, such as a warehouse table or a centralized logging index. Choose based on who owns the dashboards: analytics teams often prefer a warehouse while ops teams often prefer an observability stack. Either way keep a single schema and consistent identifiers.
How do I calculate touchless rate correctly?
Define touchless as true only when the process completes with no manual handoff and no exception stages. In practice that means emitting touchless at completion based on whether any branch set a manual_required flag or emitted an exception event. Avoid guessing based on node types because teams change nodes over time.
What are good starting thresholds for alerts?
Start with thresholds that represent real business pain: drop rate over 2%, p90 cycle time over 80% of your SLO, duplicate rate above 0.5% or 3x baseline and data quality failures above 1% or any breaking schema category. Then tune thresholds after two to four weeks of baseline data.
How do data quality checks fit into n8n without slowing everything down?
Run lightweight checks in-workflow at validation (required fields, type checks and duplicate checks) then use heavier checks asynchronously for enrichment pipelines. If a strict schema check is needed before an API write, keep the expectation set small and cache reference data so the check stays fast.