
Deadlines rarely get missed out of nowhere. Most teams see the warning signs, but they are scattered across your PM tool, time tracking and CRM so they never turn into a consistent decision. This is where predictive analytics for business operations becomes practical: build a single delay-risk score that updates continuously and automatically triggers the same internal and client actions every time risk rises.
This article is for ops leaders, delivery managers and tech-savvy founders who want an early-warning system that is operationally trustworthy, not a dashboard that gets ignored. We will cover the minimum data model, the signals that actually lead delivery, a concrete scoring workflow with thresholds and the automations that fire when risk crosses those thresholds.
At a glance:
- Stitch PM, time tracking and CRM into one project health record so risk is computed consistently.
- Compute a delay-risk score from leading indicators like scope growth, work aging, throughput volatility, timesheet gaps and client response latency.
- Use clear thresholds (green, amber, red) to trigger internal escalation, scope check-ins, approval gates and timeline updates.
- Add integrity checks, drift monitoring and human overrides so automation does not amplify bad data.
Quick start
- Pick 10 to 20 active client projects and define one committed milestone date per project.
- Create a unified project table that maps project_id across PM tool, time tracking and CRM account or deal.
- Implement 6 to 10 features (scope change rate, aging work, blocked ratio, throughput volatility, timesheet underlogging and client response latency).
- Calculate a 0.00 to 1.00 delay-risk score and set three tiers: green, amber and red.
- Trigger actions from the tier: internal alert, client check-in, approval request and a refreshed forecasted completion date.
- Add data-quality gates and drift checks. If they fail, pause client-facing automations and route to manual review.
An early-warning system for delivery delays works by turning a few reliable leading indicators from your PM tool, timesheets and CRM into a single risk score that updates on a schedule or event. When that score crosses thresholds you automatically trigger the same escalation steps every time: notify owners, request scope decisions, update timelines and log everything back into the systems of record. Safeguards like data integrity checks, drift monitoring and human approvals keep it trustworthy.
The system boundary that makes this operational
The key design choice is to treat the risk score as a control signal that drives actions, not as an analytics report. That means you need a boundary where you can reliably compute the score and emit one event that downstream workflows can consume.
At ThinkBot Agency we typically implement this as:
- Ingest layer: scheduled pulls or webhooks from PM, time tracking and CRM.
- Staging tables: a normalized project snapshot plus a feature table (one row per project per day or per week).
- Scoring service: calculates tier and top drivers then emits a risk event.
- Automation fan-out: one risk event triggers multiple workflows (Slack, email, CRM update, PM comment, approval request).

This pattern maps well to webhook-driven orchestration where a single HTTP trigger can start several workflows with clear ownership, similar to how event triggers are described in workflow trigger patterns. The key is to keep the risk event payload lean: send IDs and the score, then fetch rich context downstream. For a deeper playbook on designing reliable AI-plus-automation steps with strict contracts, approvals, and monitoring, see Build AI workflow automation that behaves like a reliable workflow step.
Minimum data model for delay-risk scoring
You do not need a data warehouse rewrite to start. You need a consistent way to join records across systems and a handful of time-series metrics.
Core entities
- Project: project_id, client_id, delivery_owner, start_date, committed_due_date, current_status
- Work items: task_id, project_id, status, created_at, started_at, completed_at, blocked_flag, estimate_points or estimate_hours
- Time entries: entry_id, project_id, user_id, date, hours, billable_flag
- CRM context: client_id, account_health, contract_type (fixed or T&M), change_request_required (yes/no), renewal_date, key_contact_email
- Comms signals (optional but valuable): last_client_reply_at, open_decisions_count, approvals_pending_count
Minimum join keys and mapping rules
- One canonical project_id that is stored in the PM tool and time tracking. If this does not exist, create a mapping table.
- One canonical client_id that maps CRM account or deal to the delivery project.
- A single committed date per project that represents the client-visible delivery promise. Avoid mixing internal sprint dates with client delivery dates.
Real-world ops insight: teams often try to score risk at the task level first. That creates noise and political debates. Start at the project or milestone level, prove usefulness and only then break down to components.
Delay-risk scoring workflow you can implement this week
The goal is a stable score that is easy to explain. You can start with a rules-weighted score before you ever train a model. Later you can calibrate weights or fit a logistic regression using your historical late versus on-time outcomes.
Inputs you collect (daily or weekly)
- Committed_due_date and days_remaining
- Remaining_work (open tasks count, remaining points or remaining estimated hours)
- Completed_work_last_7d (tasks, points or hours completed)
- New_work_added_last_7d (scope added)
- Work_item_age_stats (median age of in-progress and blocked)
- Blocked_ratio (blocked items / in-progress items)
- Timesheet_coverage (logged_hours / expected_hours for assigned team)
- Client_response_latency (hours since last client reply on open decision)
Good PM signals come from agile flow metrics like scope change and blocked work as leading indicators, not vanity velocity, as emphasized in agile delivery metrics guidance. For forecasting completion dates, using your own throughput history and percentiles is a practical way to communicate uncertainty, similar to percentile-based completion forecasting.
Feature logic (6 to 10 features, normalized 0 to 1)
Below is a concrete feature set that works well across many service delivery teams. Each feature outputs a value between 0 and 1 where 1 is high risk.
| Feature | How to compute | Why it predicts delays |
|---|---|---|
| Forecast slip probability | Compute P50 and P80 completion dates from historical throughput. Set value = 1 if P80 > due date, 0.5 if P50 > due date, else 0. | Captures the chance of missing based on your own delivery history. |
| Scope change rate | new_work_added_last_7d / max(remaining_work_start_of_week, 1), cap at 1 | Scope growth late in the cycle is a top driver of missed dates and margin erosion. |
| Aging work | median_age_in_progress_days / aging_threshold_days, cap at 1 (example threshold 7) | Work that sits in progress usually signals blocked dependencies and rework. |
| Blocked ratio | blocked_items / max(in_progress_items, 1), cap at 1 | Rising blocked work often precedes schedule slip by 1 to 2 weeks. |
| Throughput volatility | stddev(completed_work_last_4w) / max(mean(completed_work_last_4w), 1), cap at 1 | High variance means forecasts are less reliable and risk should rise earlier. |
| Timesheet underlogging | 1 - min(timesheet_coverage, 1) | Missing hours hides overrun until it is too late to adjust. |
| Client response latency | min(hours_since_last_client_reply / 72, 1) | Slow approvals and unanswered questions stall delivery even when dev work is fine. |
Score calculation (simple, explainable)
Start with a weighted average. Tune weights based on what your team believes is most predictive, then revisit after 6 to 8 weeks of outcomes.
score = 0.30*forecast_slip_probability
+ 0.20*scope_change_rate
+ 0.15*aging_work
+ 0.10*blocked_ratio
+ 0.10*throughput_volatility
+ 0.10*timesheet_underlogging
+ 0.05*client_response_latency
score = min(max(score, 0), 1)
Thresholds and tiers (keep it boring)
- Green: score < 0.35
- Amber: 0.35 to 0.64
- Red: score >= 0.65
Decision rule: if your contract model is fixed fee, lower the amber threshold (for example to 0.30) because margin risk compounds earlier. If your work is T&M with flexible scope, keep amber higher but trigger client alignment sooner when scope change rate is the driver.
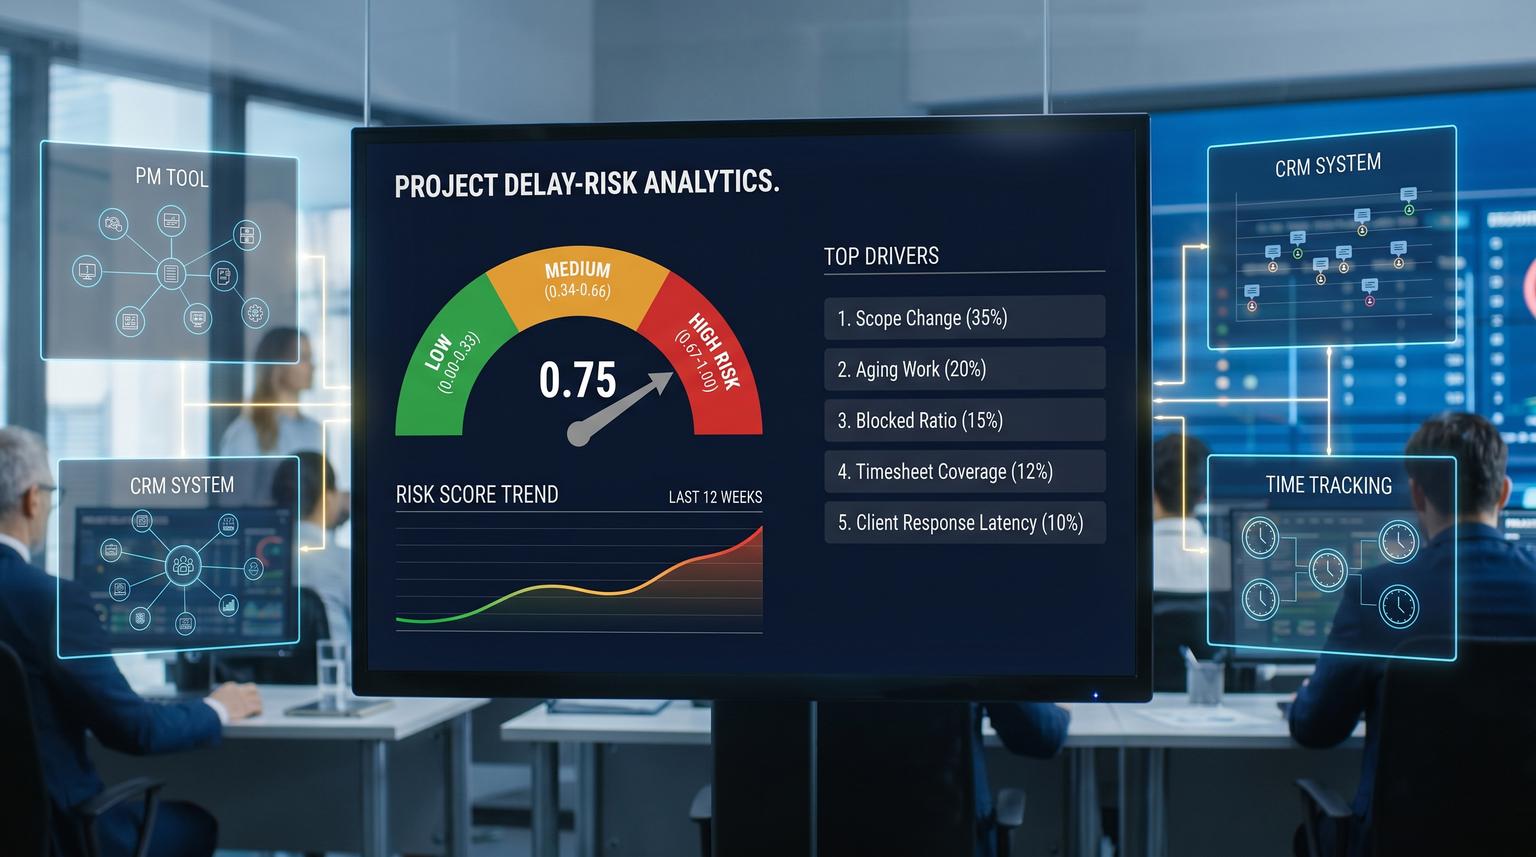
A concrete scoring run output
- Project: P123
- Due date: 2026-07-10
- P80 completion date: 2026-07-18 (slip risk)
- Score: 0.82 (red)
- Top drivers: forecast_slip_probability, scope_change_rate, timesheet_underlogging
Automation triggers and escalations tied to each tier
Predictions only help if they change behavior. Below is an escalation policy that works well because it is specific and repeatable. One common failure pattern is to trigger a generic alert that nobody owns. Every trigger below has an owner and a required next step.
Trigger entry points
- Schedule: run scoring nightly for all active projects.
- Event-based: rescore when scope changes, a milestone date changes or a critical task becomes blocked.
- Manual: a delivery lead can request a rescore after a client call or staffing change.
Risk-event payload (lean and secure)
POST /risk-events
{
"project_id": "P123",
"client_id": "C456",
"score": 0.82,
"tier": "red",
"top_drivers": ["forecast_slip_probability", "scope_change_rate", "timesheet_underlogging"],
"run_id": "2026-06-14T12:00:00Z"
}
Keep secrets out of the payload. Add authorization to the endpoint and implement replay protection (for example reject duplicate run_id per project_id) so escalations do not spam stakeholders.
Actions when tier changes (fan-out)
| Tier change | Internal actions | Client actions | System updates |
|---|---|---|---|
| Green to Amber | Slack or Teams alert to delivery owner plus ops. Create a 15-minute scope checkpoint task due in 24 hours. | Send a light check-in email asking for any pending inputs or approvals, only if client_response_latency is a top driver. | Write score, tier and drivers to CRM and PM project custom fields. |
| Amber persists 3 days | Auto-create an internal escalation ticket. Require owner to add a mitigation note in PM. | Propose two timeline scenarios (fixed scope vs scope growth) and request confirmation. | Post a PM comment that captures forecast dates and mitigation plan. |
| Any to Red | Page a senior delivery lead. Auto-schedule an internal war room slot. Open an approval gate for scope or staffing changes. | Send a formal timeline update with revised date ranges plus a change request or approval request if scope is driving risk. | Update CRM deal notes and create a risk activity log entry for auditability. |
| Red to Amber or Green | Notify stakeholders that risk is reduced and capture what changed. | Optional: confirmation email only if a prior client escalation was sent. | Close the escalation ticket with reason codes (scope stabilized, approvals received, blockers resolved). |

Tradeoff to decide early: fully automated client emails versus human approval. In most teams we recommend human-in-the-loop for the first 4 to 8 weeks and permanently for red-tier external messages. Internal alerts can be fully automated much sooner. If you want a comparable pattern applied to cash collection workflows, see predictive analytics that flags late payments automatically.
Primary CTA: If you want ThinkBot Agency to implement the scoring pipeline, integrations and escalation automations in n8n with the right safeguards, book a consultation and we will map your current tools to a deployable risk score in one working session.
Reliability safeguards so the score stays trustworthy
A delay-risk system breaks in predictable ways: joins fail, nulls spike, a tool changes a field name or your delivery process changes so last quarter's thresholds stop matching reality. You need three guardrails: data integrity gates, drift monitoring and human overrides.
Data integrity checks before scoring
Run integrity checks on the stitched dataset before feature computation. A good pattern is to fail closed for client-facing automations and fail open for internal monitoring (still compute a score but mark it untrusted).
- Referential integrity: every time entry must map to a known project_id.
- Date ordering: start_date <= committed_due_date and completed_at cannot precede started_at.
- Null share thresholds: if more than X% of projects have null due dates or missing remaining_work then pause automations.
- Plausibility caps: hours per user per day within a realistic bound for your org.
Tools like Great Expectations are designed for this kind of integrity validation in multi-table joins, including custom SQL expectations that fail when unexpected rows exist, as shown in data integrity validation examples. For a practical guide on guardrails at the CRM/API boundary (safe writes, retries, and rollback patterns), use a failure map for AI automation in business workflows.
Drift monitoring for feature health
Even if your data is clean, distributions can shift. For example, you move from weekly sprints to continuous flow, or you start tracking blocked work more accurately, or you add a new service line with different cycle times. Monitor drift on the feature table using a reference window (for example the last 60 days) and compare to the current 14 days.
- Run column-level drift tests for numerical and categorical features.
- Track null share separately because drift tests may not catch missingness changes.
- Define a dataset-level rule, for example: if 50% of features drift then require review before sending any client messages.
Libraries like Evidently describe practical defaults for drift detection based on sample size and feature type, including KS tests for smaller sets and Wasserstein distance for larger sets, in their drift documentation.
Human-in-the-loop overrides
- Freeze switch: ops can pause all client escalations while keeping internal alerts running.
- Per-project mute: temporarily mute a noisy project while you fix mapping or process issues.
- Override tier: allow a delivery lead to set tier manually with a reason code that is logged.
Implementation checklist for n8n or similar automation stacks
Use this to keep the build tight and avoid the most common mistakes.
- Define the canonical project_id and client_id mapping before you build workflows.
- Pick a scoring cadence (nightly is usually enough) and one event trigger (scope change) for fast updates.
- Store feature rows with timestamps so you can explain why a score changed.
- Write scores back to both PM and CRM so people see risk where they work.
- Make tier changes idempotent: only fire escalations when tier changes or persists for a defined window.
- Design the escalation workflow as a fan-out from one risk event to avoid duplicated logic.
- Add data-quality gates that can block client-facing actions.
- Start with human approval for external emails then gradually automate lower-risk messages.
- Log every action taken (who, what, when, why) for audit and postmortems.
What this is not the best fit for
This approach is less effective when you do not have repeatable work patterns or when delivery dates are not meaningful commitments. If every project is a one-off research effort with constantly changing definitions of done then any score will be unstable. It is also not ideal when you cannot capture basic signals like remaining work and completed work consistently, or when delivery is driven almost entirely by third-party dependencies you do not track.
FAQ
How long does it take to get a useful delay-risk score running?
Most teams can ship a first version in 2 to 4 weeks if project IDs can be mapped across tools. The fastest path is a rules-weighted score with 6 to 10 features, nightly scoring and tier-based automations that log actions back into your PM and CRM.
Do we need machine learning to predict delivery delays?
No. A transparent score built from leading indicators like scope growth, aging work, blocked ratio and forecast slip can be effective. Once you have 2 to 3 months of outcomes you can calibrate weights or train a lightweight model, but the operational value mainly comes from consistent thresholds and actions.
What data is the most predictive when projects start slipping?
In practice the strongest signals are forecasted completion drifting past the committed date, scope added after commitment, work items aging in progress or blocked states, timesheet underlogging and slow client approvals. The best set depends on your delivery model, but these tend to generalize well.
How do we avoid spamming clients with false alarms?
Use tier changes and persistence rules so you only escalate when risk meaningfully rises or stays elevated for several days. Add data-quality gates and drift checks to block external messages when inputs are unreliable. Keep human approval for red-tier client updates until you have proven stability.
What should happen when data quality checks fail?
Pause client-facing automations, alert ops and mark the score as stale or untrusted. You can still send internal notifications that the pipeline is degraded. Once integrity checks pass again, resume automations and backfill scores if needed.