
Most teams do not struggle to find automation ideas. They struggle to prove which ideas will pay back first and which ones will quietly fail because of messy exceptions, brittle handoffs or hidden integration work. This article shows you how to run a one-department audit that turns business process automation benefits into numbers, then into a ranked backlog your stakeholders can approve.
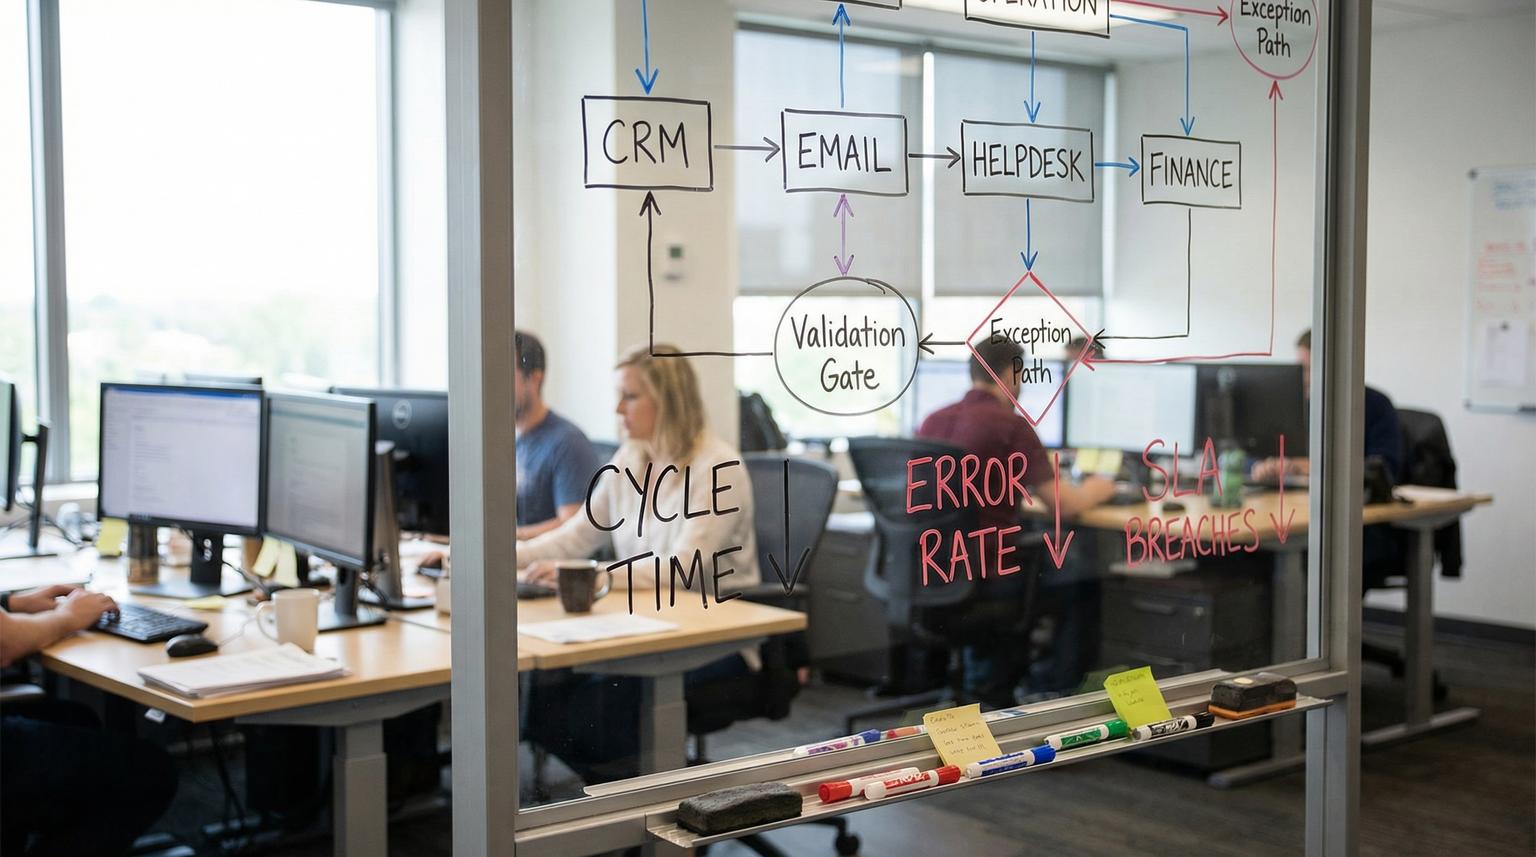
You will map one team end to end, capture baseline metrics like cycle time, touchpoints, error rate, rework and SLA breaches then score each candidate with a simple ROI plus risk model. You will also flag integration boundaries like CRM, email, finance and support that change both effort and reliability.
At a glance:
- Start with one department and 5 to 12 workflows so you can measure baseline reality fast.
- Score value with time saved, error cost avoided, volume and SLA impact.
- Score delivery risk with exceptions, integration complexity and upstream volatility.
- Use a value vs effort matrix to pick 3 to 5 automations that are fundable and achievable.
Quick start
- Pick one department and a 2 to 4 week window of work to sample (sales ops, support ops, finance ops or marketing ops).
- List 5 to 12 repeatable workflows with clear start and end points.
- Capture baselines for each: cycle time, manual touchpoints, error rate, rework minutes and SLA misses.
- Fill in the ROI scoring sheet and compute Value Score, Effort Score and Risk Score.
- Plot candidates on the prioritization matrix and select the top 3 to 5 for the next automation sprint.
A structured ROI audit works by measuring today first then scoring each workflow like an investment memo. You quantify expected value (labor minutes, error cost, SLA impact) then discount it for real-world delivery factors (exceptions, integrations, upstream changes). The result is a ranked backlog and a clear quick wins vs high impact view so leadership can fund automation with confidence. For a broader view on streamlining end-to-end workflows, see our guide on business process optimization with automation.
Why most automation ROI gets overestimated
In operations, automation value usually gets inflated in two ways.
- Happy-path bias: teams estimate time saved assuming perfect inputs. In production, exceptions and edge cases drive most of the manual effort. A due diligence mindset helps here because it forces you to measure variation, exception handling time and rework before you approve a build. See this value and risk assessment approach.
- Step-level thinking: teams automate one step inside a journey and ignore upstream and downstream handoffs. That caps returns because the bottleneck just moves to the next handoff. McKinsey highlights this end-to-end issue in its view on automation and humans: focus on the full journey.
A practical decision rule we use at ThinkBot Agency: if you cannot define the before metric and the owner who will validate it after, do not prioritize the workflow yet. Park it until you can measure it.
Step 1 Map one department workflow end to end
Scope is your friend. Pick one department with real volume and lots of handoffs. Common starting points we see work well in 2026:
- Sales ops: lead routing, inbound enrichment, quote to invoice handoff
- Marketing ops: form to CRM sync, webinar follow-up, lifecycle email branching
- Support ops: ticket triage, refund eligibility checks, knowledge base suggestions
- Finance ops: invoice intake, approvals, payment reminders, reconciliation prep
How to map without turning it into a month-long project
Run a 60 to 90 minute working session with the people doing the work. Your output is a simple table, not a perfect diagram. If you want the full step-by-step method to inventory workflows and document them with SIPOC and swimlanes, use our pillar guide: business process automation playbook to map, standardize and automate back-office workflows.
| Field | Fill in |
|---|---|
| Workflow name | ____________ |
| Trigger (start) | ____________ |
| Outcome (end) | ____________ |
| Systems touched | CRM / Email / Helpdesk / Finance / Sheets / Other: ____________ |
| Human roles involved | ____________ |
| Handoffs | Count: ____ Notes: ____________ |
| Top 5 exception types | 1) ____ 2) ____ 3) ____ 4) ____ 5) ____ |
Real-world ops insight: the fastest way to find automation candidates is to count how many times someone copies data between tools. If a workflow requires copy/paste between CRM and email platform or helpdesk and finance, that is usually where time, errors and delays cluster.

Step 2 Capture baseline metrics that stakeholders trust
Before scoring, measure. Otherwise your ROI becomes an opinion contest. Microsofts measurement guidance for business value is clear on this: define metrics and capture a benchmark.
Baseline fields to collect for each workflow
- Cycle time: average minutes from trigger to completion (and calendar time if approvals are involved)
- Manual touchpoints: number of human actions required (data entry, status updates, approvals, follow-ups)
- Error rate: percent of runs that need correction
- Rework: minutes spent fixing errors or chasing missing info
- SLA breaches: number of times per month you miss an internal or customer-facing SLA
- Volume: transactions per week or month
How to collect quickly without perfect tooling
- Pull 20 to 50 recent examples from your systems (CRM records, tickets, invoices).
- Ask the team to time 5 real runs and average it.
- Use system logs where possible (helpdesk timestamps, CRM stage timestamps).
- Write down assumptions next to the numbers so you can refine later.
Common failure pattern: teams only measure the main path and ignore the exception workload. If exceptions consume 30 percent of time and you do not model them, your forecasted savings will not show up after launch.
Step 3 Fill in the ROI scoring sheet and compute a score
This is the fill-in-the-blank scoring sheet we use to translate baseline pain into a ranked list. You can copy it into a spreadsheet and score 5 to 12 workflows in one session.
Fill-in-the-blank ROI scoring sheet
| Input | Fill in | Notes |
|---|---|---|
| Workflow name | ____________ | |
| Monthly volume (V) | ____ transactions/month | Use a conservative average |
| Minutes per transaction today (M) | ____ minutes | Include exception handling time |
| Percent of time automatable (A) | ____ % | Do not assume 100% |
| Loaded labor cost per hour (L) | $____ /hour | Use internal blended rate |
| Error rate today (E) | ____ % | Only errors that cause rework or customer impact |
| Cost per error (C) | $____ /error | Refunds, credits, labor, churn risk proxy |
| SLA breaches today (S) | ____ /month | Late response, late invoice, late fulfillment, etc |
| Cost per SLA breach (B) | $____ /breach | Penalty fees or time to recover or escalation labor |
| Integration complexity (IC) | 1 to 5: ____ | 1 = single system, 5 = 3+ systems with weak APIs |
| Exception complexity (XC) | 1 to 5: ____ | 1 = predictable, 5 = frequent branching and missing data |
| Data sensitivity and compliance (DS) | 1 to 5: ____ | PII, financial data, audit trail requirements |
| Upstream volatility (UV) | 1 to 5: ____ | How often inputs, forms or rules change |
Calculations (copy into your sheet)
Monthly labor hours saved = (V * M * (A/100)) / 60
Monthly labor $ saved = Monthly labor hours saved * L
Monthly error $ avoided = V * (E/100) * C
Monthly SLA $ avoided = S * B
Monthly value estimate = Monthly labor $ saved + Monthly error $ avoided + Monthly SLA $ avoided
Convert to a simple 0 to 100 score
Use three scores so you can rank and compare. Keep it simple and consistent.
- Value Score (0 to 50): map Monthly value estimate into 1 to 5 bands then multiply by 10. Example bands: 1 = under $500, 2 = $500 to $2k, 3 = $2k to $7k, 4 = $7k to $20k, 5 = over $20k.
- Effort Score (0 to 30): (IC * 4) + (XC * 2). Lower is better. Normalize later if you want, but even this rough score surfaces hidden work.
- Risk Score (0 to 20): DS + UV + (XC). Lower is better.
Then compute a ranked priority number:
Priority Score = Value Score - Effort Score - Risk Score
Tradeoff to decide upfront: if your org is in a regulated environment or you have high customer risk, increase the weight of Risk Score so you stop pushing risky workflows into the top of the list just because they are high volume.

Step 4 Build a prioritization matrix that makes the decision obvious
Numbers are great but stakeholders also need a clear visual. A matrix makes the conversation faster and less political. Salesforce Trailhead describes the idea of comparing candidates on a matrix of qualifiers vs benefits: process matrix scoring. We adapt that into value vs effort so delivery teams can plan realistically.
Value vs effort prioritization matrix (2x2)
Plot each workflow as a point. Y-axis is Value Score. X-axis is Effort Score. Use Risk Score as a color or a flag.
| Low effort | High effort | |
|---|---|---|
| High value |
Quick wins
|
High impact
|
| Low value |
Fillers
|
Avoid for now
|
A simple selection rule: choose 2 to 3 quick wins plus 1 to 2 high impact items for your next cycle. That mix creates measurable savings while building capability for harder cross-system work.
Step 5 Flag integration boundaries that change effort and reliability
Integration boundaries are where automation programs either compound value or become a maintenance burden. In a one-department audit, you are looking for these boundary types:
- CRM boundary: lead and account data quality, validation rules, ownership and dedupe logic
- Email platform boundary: unsubscribes, deliverability constraints, template governance and event tracking
- Helpdesk boundary: ticket state machines, macros, identity matching, attachments and PII
- Finance boundary: approvals, audit trails, invoice numbering, payment status and reconciliation timing
A quick boundary checklist (use during scoring)
- Is there a stable API for the system or will you rely on brittle UI steps?
- Are there rate limits or webhook gaps that force polling?
- Is the required data present at the trigger point or only later?
- Does the workflow require bi-directional sync or one-way updates?
- What is the rollback plan if a sync misfires and writes bad data?
Operational reality check: the same workflow can swing from low effort to high effort depending on whether you have clean identifiers. For example, if support tickets do not reliably match CRM contacts, any automation that updates CRM from the helpdesk will need a matching strategy plus exception queues, not just a simple integration. If you are evaluating tooling and reliability tradeoffs for cross-app workflows like these, compare options in our n8n vs Zapier vs Make comparison guide.
Step 6 Prevent brittle automations with failure modes and mitigations
Your audit should not only rank value. It should reduce delivery risk. These are common breakpoints we see across n8n, CRMs, email platforms and helpdesks.
| Failure mode | What it looks like | Mitigation you can plan now |
|---|---|---|
| Exception overflow | Automation handles happy path but exceptions still flood the team | Define an exception queue, add validation at intake and track exception rate as a KPI |
| Upstream field change | A form, pipeline stage or custom field changes and automations start failing | Use a canonical data contract, add tests and add alerts for schema changes |
| Duplicate records | CRM gets duplicates and downstream emails or invoices go to the wrong entity | Implement dedupe rules, enforce identifiers and add human review for ambiguous matches |
| Silent partial runs | Some steps complete but the workflow does not finish and nobody notices | Add end-to-end run logs, error notifications and a daily reconciliation report |
| Permission and compliance gaps | Automation can access data it should not or changes lack auditability | Least-privilege service accounts, audit trail logging and a sign-off gate for sensitive flows |
When this approach is not the best fit: if your department is in active process redesign, a full ROI scoring exercise can be premature because the workflow will change next month. In that case, focus on stabilizing the process and data contracts first then score the new steady-state version.
Step 7 Turn the scores into a funded backlog and an ROI dashboard
Once you have Priority Scores and a matrix, convert them into a backlog that leadership can approve. Each line item should include the metric you will report after launch. This aligns with how leaders expect ROI visibility through consistent questions, metrics and dimensions, similar to an ROI dashboard structure. For examples of how teams tie ROI to real-world outcomes in practice, see no-code workflow solutions case studies and ROI metrics.
Backlog fields to include
- Workflow name and owner
- Baseline metrics (cycle time, error rate, SLA misses, volume)
- Expected value drivers (time saved, error cost avoided, SLA improvement)
- Systems and integration boundaries (CRM, email, helpdesk, finance)
- Effort and risk notes (exceptions, data sensitivity, upstream volatility)
- Acceptance criteria and how you will measure success after go-live
What to measure after launch (so ROI stays real)
- Automation runs per week and percent successful runs
- Exception rate and average exception handling time
- Cycle time before vs after
- Error rate before vs after
- SLA breaches before vs after
- Adoption signal: is the automation actually being used or bypassed
If you want a second opinion on your scoring sheet or you need help implementing the top candidates in n8n with reliable monitoring and rollback, book a working session with ThinkBot Agency here: book a consultation.
If you prefer to review similar automation work first, you can browse our examples here: ThinkBot portfolio.
FAQ
Common follow-ups we hear from ops leaders after they run this style of audit.
How many processes should I score in one department?
Start with 5 to 12 workflows. That is enough to find patterns and build a ranked backlog without getting stuck in analysis. If you have more than 12, cluster similar workflows and score the cluster first.
What if time saved is real but finance says it is not cash savings?
Convert time saved into one of three outcomes: capacity redeployed to revenue work, capacity absorbed to avoid hiring or reduced SLA escalations and rework. In the scoring sheet, keep the labor value conservative and include error and SLA costs so the model does not rely on labor savings alone.
How do I estimate error cost if I do not have a clean dollar number?
Use a proxy: average minutes of rework times loaded labor rate plus any direct costs like credits, refunds or expedited shipping. Document the assumption. The goal is consistent comparisons across workflows, not perfect accounting.
What is a reasonable way to score integration complexity?
Use a simple 1 to 5 scale based on number of systems and reliability. A single system with a stable API is a 1 or 2. Multi-system sync across CRM, email and finance with weak identifiers and rate limits is a 4 or 5.
How often should we rerun this audit?
Quarterly works well for most teams or after any major system change like a CRM migration. Each rerun should reuse the same fields so you can see how value, effort and risk change over time.